In this post, we discuss:
- How to combine simulation results and technical illustrations to communicate complex process knowledge
- Analysis of field study on practical implementation of a simulation tool for enhanced learning
- Suggestions for application areas that might benefit from simulation tools during learning /training.
Introduction
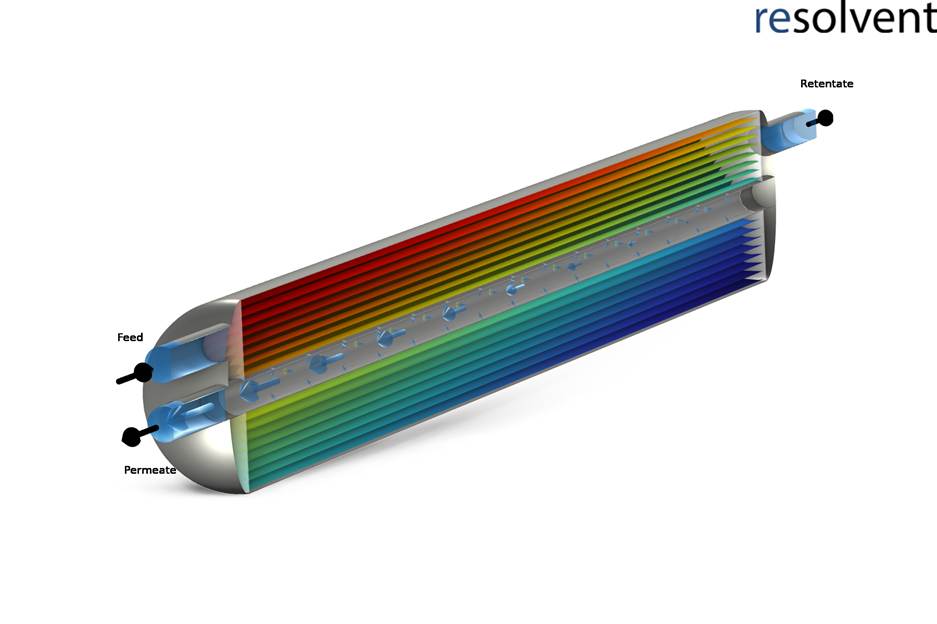
Process illustration and animations are helpful in visualising the working principles of equipment. Especially to visualise nonvisible fluid flow paths in plate heat exchangers or membranes, electrical current flow in electrolyser stacks, and so on.
One thing is understanding the concept of a membrane filtration process with concepts of permeates and retentates. However, there are several realisations of a membrane filtration process with each its advantages, disadvantages, and areas of use (e.g., hollow fibre, spiral wound, flat sheet). The same applies to heat exchangers (e.g., shell-and-tube, plate, coil).
A clear communication of equipment working principles gives a competitive advantage in for example
- Marketing. If an equipment company offers a unique physical realisation of equipment to deal with process constraints, mechanical constraints, material constraints, etc., visualisations significantly aid in conveying these advantages to the engineers in charge of selecting suitable equipment.
- Equipment design. For product development activities, the understanding of the working principles and limitations in an equipment gives opportunities for improvement. This applies to entire organisations including staff without engineering background.
- Process design and optimization. Identification of bottlenecks in a design – even spatial! When integrated in the testing phase, it can give inputs in planning of experiments, ultimately guiding the scale up process.
The physical realisation often requires compromises that causes the final product to deviate from an idealised process, contributing further to undesired gradients.
Simulation for Taking Visualisations to the Next Level
You can come a long way by visualising material flow directions. However, sometimes intuition cannot predict the flow path of material processed inside complex equipment, or it may be difficult to map the concentration profile in a colourless fluid experimentally.
Simulation enables insights in processes that cannot be measured. One might say that as a bonus of a simulation projects, visualisations to communicate the learnings in powerful visualisations serves an effective method of increasing process understanding across an organisation. This is called “democratisation” of the expertise.
A Case Study: Practical Course Exercise
A simulation tool was developed to facilitate:
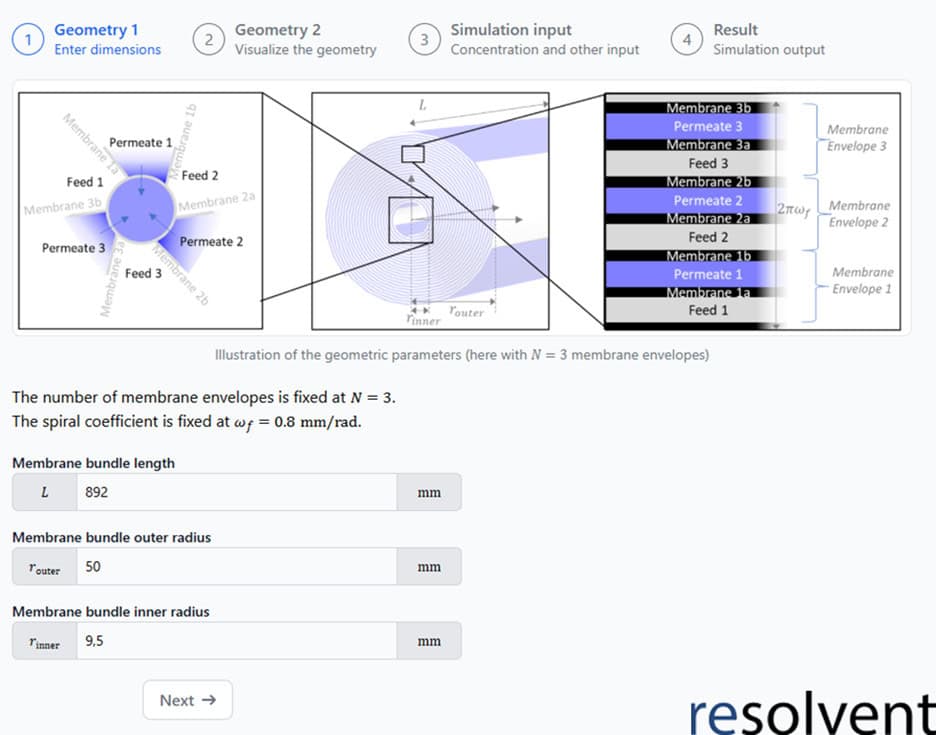
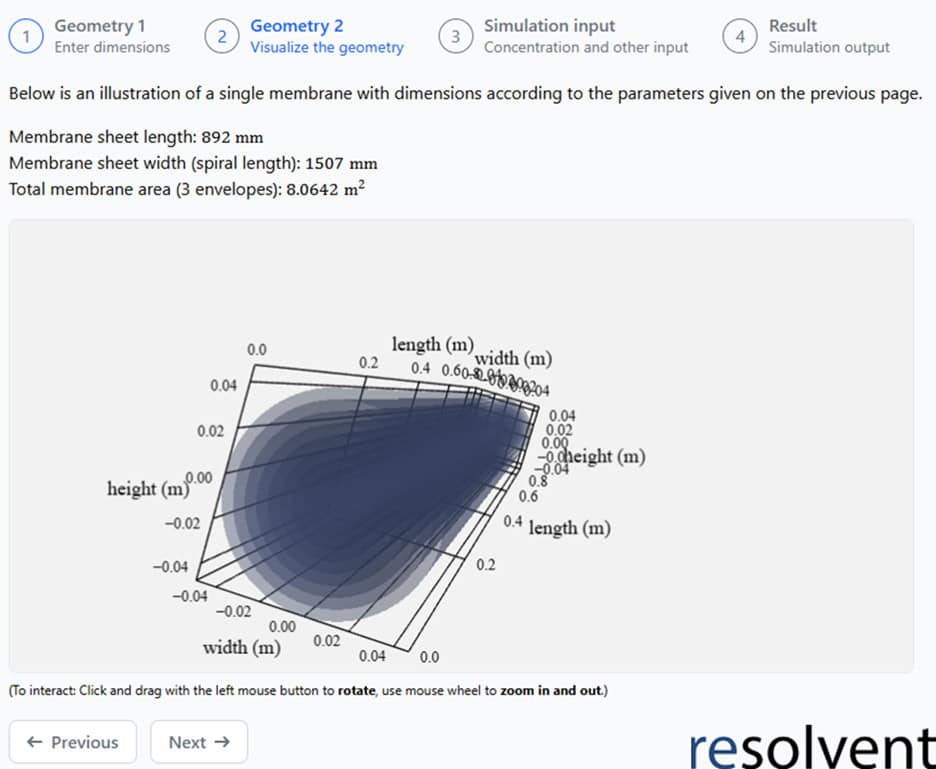
- familiarisation of inner geometries of the spiral membrane using visual feedback of geometry changes (lengths, radii, channel configurations)
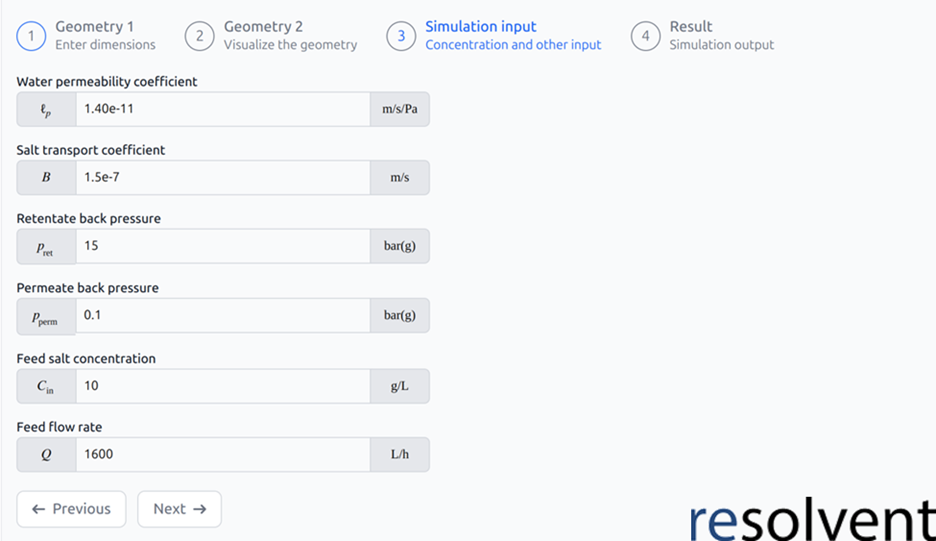
- analysing performance variations between idealised conditions and 3D model simulations using visualisations of pressures and concentrations to focus on gradients.
The hypothesis was that the simulation tool resulted in a low-effort increased understanding of spiral-wound membranes after performing a practical exercise on the same equipment.
This study was tested on volunteering students following a practical course at Department of Chemical and Biochemical Engineering, Technical University of Denmark. The tool was applied to an exercise involving a spiral wound membrane unit at pilot plant scale (see Saltwater Desalination with 3D Modelling in Reverse Osmosis).
Conventional Approach: Experiment, Analyse, and Report
The exercise was composed of the classical workflow: (1) Preparation and familiarisation. (2) Conduct experiment. (3) Apply theory on own generated data.
Depending on the effort in the preparation and familiarisation phase, conducting the experiment requires a relatively high mental load (is this valve safe to open? What is this noise? If I do this wrong, I must start over). High quality data generated eases the reporting task. For phase 3, good learning material helps to break down the task, e.g., by a series of questions, facilitating the elements of remembering, understanding, applying, and analysing. The final question in the exercise manual already involved more high-level objectives (evaluate and create) on a theoretical level.
New Exercise Question: Involving a Simulation Tool
Using the parameters obtained in the exercise the students had to design and scale-up a saltwater desalination plant. With help of the simulation tool, they needed to investigate the membrane geometry and its influence on internal gradients. Gradients cannot be seen and visualised with the pilot plant data but are important to consider at the scale up.
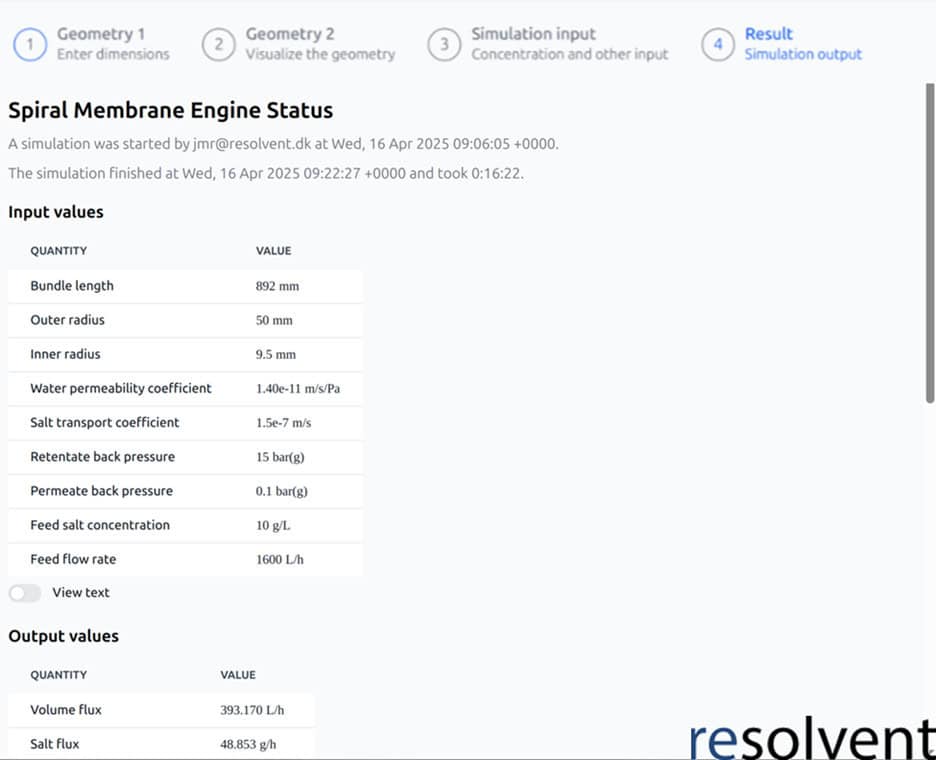
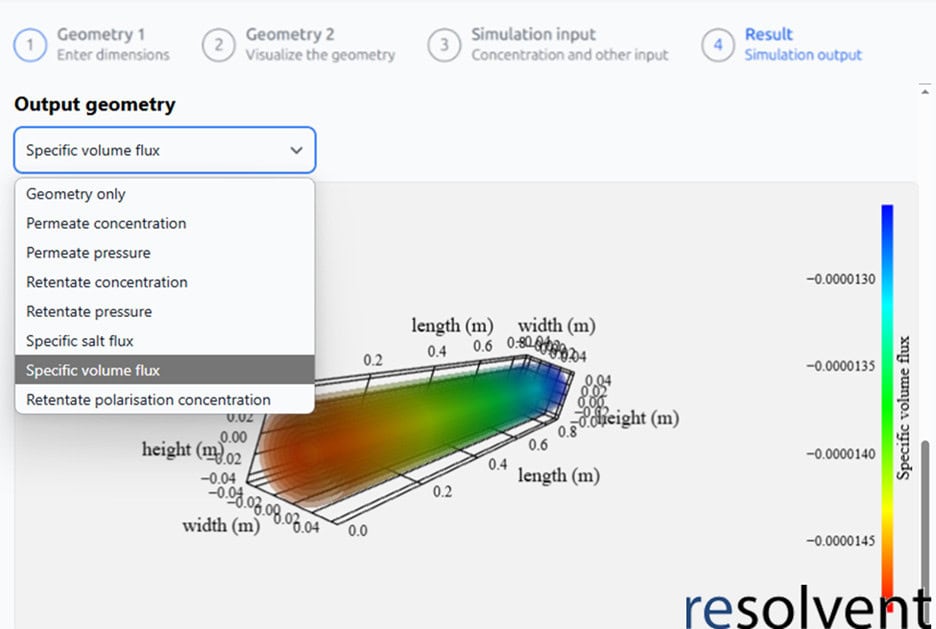
Therefore, a custom-made simulation tool was available to answer this question. A workflow wizard was adopted to setup the simulation (Figure 1, Figure 2, Figure 3, Figure 4, and Figure 5).
Playing with length and width and looking into the gradients and then choosing a good trade off between (pressure drop mainly when increasing the diameter) and lower permeate flux and salt retention due to increased gradient when increasing the module length.
User Feedback
Feedback was collected during an informal session. Some quotes are provided below. Distilling the message, there was overall positive feedback emphasising the power of visualisation for learning and additional possibility for continuing the experimentation at any time to satisfy the curiosity.
The conclusion is that the inner working principles of the spiral-wound membrane were understood, and that challenges in scaling up a membrane was sufficiently addressed during the saltwater desalination plant dimensioning exercise.
“It works nice as promoter for discussion. The tool doesn’t need calculations so we can focus on understanding.”
“Visualisation tool is really good. Interesting to see how the membrane looks inside.”
“Quite precise results compared to experimental data.”
“Allowed for some confirmation of the parameters obtained in data fitting for the gathered data and established models.”
“Never had something similar in a course. Understand more practically.”
“Improve understanding of geometry and how spiral filtration work.”
Who and Which Situations Will Benefit from these Findings?
We demonstrated how such simulation and visualisation tools can be leveraged to convey complex technical information without excessive mental effort.
Such tools can be developed in relation to a modelling/simulation project to showcase the knowhow obtained or to communicate existing knowledge in a simple and visual manner.
Some relevant uses:
- Operator training. Improve understanding to improve on-floor incident handling potentially avoiding manufacturing deviations.
- Engineering tools. Faster iterations on complex multi-variable designs and faster on-boarding.
- Democratisation of knowledge. “Where” and “Why” does equipment not perform optimally?
- Marketing. What are the unique selling points.
Acknowledgement
The experiments were conducted and kindly provided by the Department of Chemical and Biochemical Engineering, Technical University of Denmark, Pilot Plant. Thanks to the course students Lev and Mykhailo for testing the tool and providing feedback on it.