Introduction
Electric car sales have increased exponentially in the past years exceeding 10 million sales in 2022 [1]. Similarly, battery use in grid-scale energy storage solutions has been receiving increasing attention due to easier scalability compared to conventional gravity-based technologies (e.g., hydropower).
Lithium-ion batteries (LIB) are today the most common battery-type chemistry for the above applications. However, due to supply-chain challenges of constituting raw materials such as Lithium and Nickel, efforts to increase raw material usage efficiency and battery lifetime performance are important factors among the developments of new battery technologies.
This post aims to outline the theoretical foundation of state-of-the-art LIB modelling and simulation, and to exemplify the use of battery simulation for optimising battery system design and operation over the battery lifetime.
Battery Materials
Nickel-Cobalt-Manganese (NCM) based LIB is the most dominant battery chemistry with a market share of 60% in 2022 followed by Lithium ferrophosphate “Olivine” (LFP) with a market share of 30% [1]. LFP is growing for bus and truck applications, in particular, due to high durability, low cost, and long lifetime. Some example performance characteristics are provided in Table 1 for the mentioned LIB chemistries. NMC and LFP offer the choice between durability/price versus specific energy, which must be considered in the electrical application of the LIB when selecting a battery system.
Table 1. Battery performance of the two most common Li-ion chemistries. Source: [2].
| Parameter | NMC | LFP |
| Voltage nominal | 3.60 V to 3.70 V | 3.20 to 3.30V |
| Voltage typical | 3.0 to 4.2 V per cell | 2.5 to 3.65 V per cell |
| Specific energy | 150-220 Wh/kg | 90-120 Wh/kg |
| Cycle life | 1000-2000 | >2000 |
| Thermal runaway temperature | 210 °C | 270 °C |
Chemistry Inside the Battery
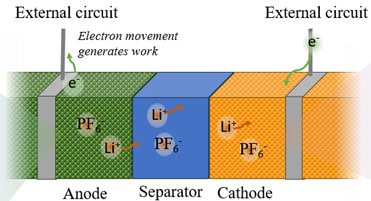
A LIB resembles a sandwich of repeating multiple layers: Anode current collector, anode, separator, cathode, cathode current collector (See Figure 1). Anode, separator, and cathode are porous structures containing a liquid electrolyte within the matrices. Graphite is the most common anode material. A graphite anode can be used with, for example, an NMC cathode or an LFP cathode. A fully charged battery has the anode filled with intercalated Lithium. The separator is nonconducting while it allows for electrolyte transfer. The electrolyte consists of dissociated salt (commonly LiPF6) in a solvent (commonly alkyl carbonates). The repetition of layers can be obtained by either stacking, Z-folding, or winding (“jelly-roll”), and encased into a cylindrical, prismatic, or pouch-type encasing. Note that there is ongoing work for developing next-generation batteries: Sodium-ion batteries (Lithium-ion replacement) and solid-state batteries, which may have different chemistries.
Electrolyte
Lithium-ions (Li-ion) in the electrolyte solution act as blood in the veins of the battery. They transfer freely in the electrolyte according to the following equation [3]:

The first term denotes the time-dependency of the Li-ion concentration in electrolyte solution, the second and third terms are effective ionic diffusion, and final term is the sum of surface reactions (i.e., intercalation and degradation reactions). Subscript j denotes the layer with n=negative electrode (anode), s=separator, and p=positive electrode (cathode).
Electrode
Assuming spherical electrode particles, Li-ion reacts with the electrode particle surface (e.g., intercalate /deintercalated) at rate Jtot,j

and intercalated Lithium diffuses inside the electrode particles. The particles have radius of ẟP, j .

Heat and charge are transferred in the electrolyte and electrode according to conservation laws (not given here) with the exception that the anode and cathode are electrically separated due to the separator.
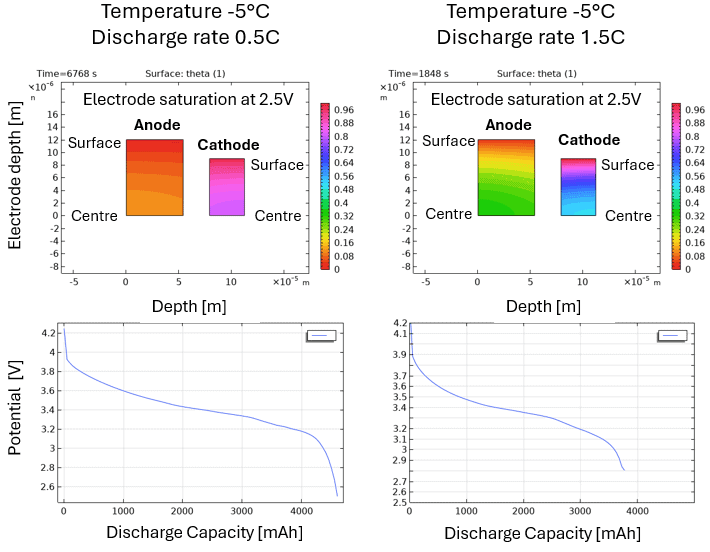
Interestingly, only the Lithium in the surface of the electrode particles is available for electrochemical reaction. This explains why fast discharge can cause significant battery voltage drop owing to Lithium depletion in the electrode surface while diffusion of Lithium cannot keep up with the supply. Ultimately, this situation leads to a low discharge capacity. This particularly applies at low temperatures, since diffusion rate will be rate limiting. Figure 2 illustrates this situation. The left-hand column is the slow discharge rate case, and the right-hand column is the fast discharge rate case, both at -5 °C. Notice the unutilized Lithium (high saturation) in the particle centre of the anode at high discharge rate. Note that 1C-rate discharge means that discharge time is 1 hour.
Battery Degradation
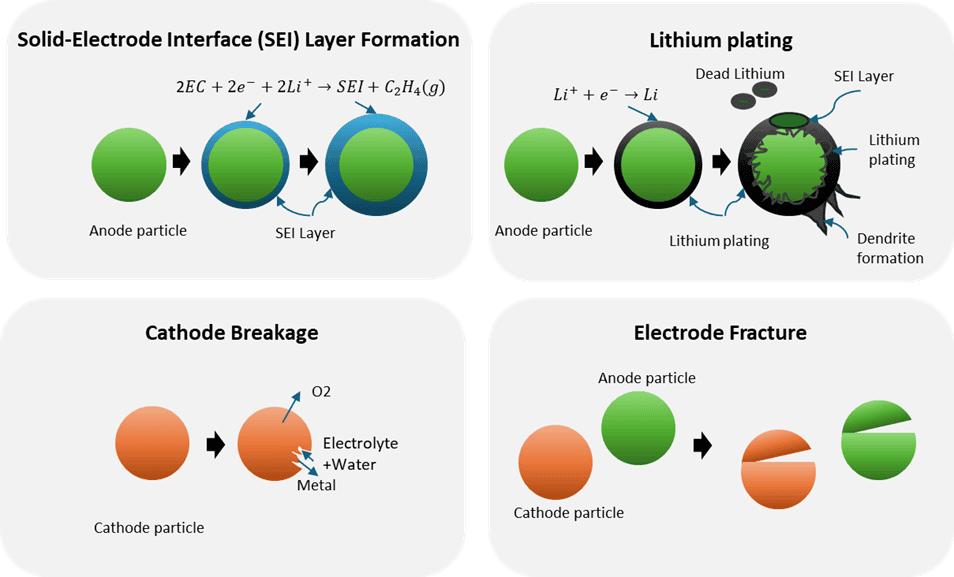
Electrical capacity will inevitably decrease over time for a LIB while internal resistance increases due to several degradation mechanisms depending on its historical conditions. Some important factors are temperature, state of charge, and load profile. Consequently, both capacity loss and power loss are observed over time. The four main degradation mechanisms see Figure 3 currently understood are:
- Solid-electrolyte interface (SEI) formation. Anodes particles irreversibly develop a layer consisting of a variety of compounds, mainly solvents. The SEI layer also consumes Lithium, while imposing electric resistance.
- Lithium plating. Metallic Lithium reversibly forms on the anode instead of intercalating. Plating can cause pore clogging, “dead Lithium”, and/or dendrite formation.
- Cathode breakage. This can be structural changes or decomposition. E.g., the solvent can react with the cathode to form gaseous CO and/or CO2, moisture ingress can cause an acid attack, and /or undesired interactions between transition metals and Lithium.
- Electrode fracture. Particle fracture due to stress conditions, such experienced at high discharge rate.
SEI formation is considered the primary degradation mechanism during the first cycles of battery discharge /charge. The SEI formation can be modelled using the approach of Safari et al. [4]. In this approach, solvent (ethyl carbonate, EC) diffuses through the SEI layer and reacts with electrode particles at the interface, from where new SEI layer is formed. In this process, both solvent and Lithium are consumed.

The above set of equations allow the tracking of SEI layer thickness (degradation status) in any position of a battery using the growth rate VSEI . The SEI layer thickness is assumed to be small compared to particle radius.
Application Example
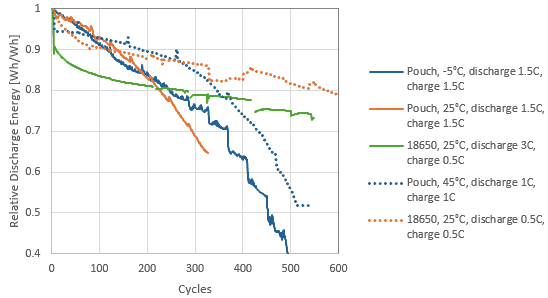
Batteries are typically tested in laboratories under constant conditions (see Figure 4 as an example) to verify adherence to specifications when operated at recommended working ranges (e.g., temperature). These working ranges are typically used when designing battery application systems (incl. thermal management systems) and may lead to over dimensioning or predictions of lifetime that are estimated as too short, if the actual working conditions are significantly narrower. Both cases lead to unnecessary increased use of materials.
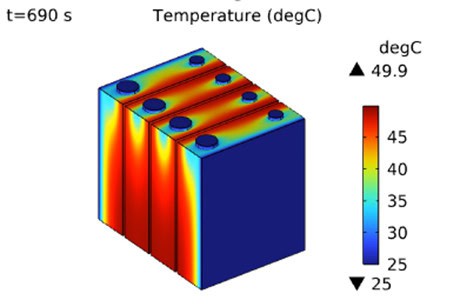
A calibrated battery simulation model (see Figure 5) enables accelerated in-silico cycling testing to quantify its performance during its lifetime subject to varying conditions. This offers a unique opportunity for optimizing battery material use and its lifetime by minimizing degradation, significantly improving the application business case. Battery models can be coupled with other physics such as heat transfer and /or fluid dynamics to evaluate for example thermal management system performance (air cooling, direct liquid cooling, phase change material cooling, etc.) for specified geometries and load scenarios. Figure 6 illustrates the 3D temperature profile during discharge of a small battery module

Summary
In summary, advanced models of battery chemistry, transport phenomena, and degradation mechanisms, enables prediction of state of health on battery cell-level in battery pack applications, accounting for the experienced cycle conditions by the combined system. Multiphysics simulations of these models enable optimisation of the design and operation of battery packs.
Citations
[1] https://www.iea.org/reports/global-ev-outlook-2023/trends-in-batteries
[2] https://batteryuniversity.com/article/bu-205-types-of-lithium-ion
[3] Doyle, M.; Fuller, T.F.; Newman, J. Modelling the Galvanostatic Charge and Discharge of the Lithium/Polymer/Insertion Cell. Journal of the Electrochemical Society, 140(6): 1992, 1-35.
[4] Safari, M.; Morcrette, M.; Teyssot, A.; Delacourt, C. Multimodal Physics-Based Aging Model for Life Prediction of Li-Ion Batteries. Journal of the Electrochemical Society, 156 (3): 2009, A145-153.
[5] https://www.batteryarchive.org/
Acknowledgements
The authors would like to acknowledge the financial support by the European M-ERA.NET 3 call (project9468 LaserBATMAN), Innovation Fund Denmark (grant number 1139-00001), and the Swedish Governmental Agency for Innovation Systems (Vinnova grant number 2022-01257).