Introduction: Model-based Scale-up and Technology Transfer
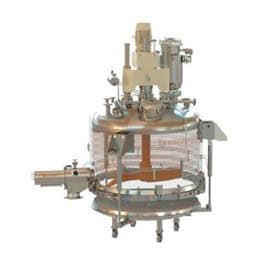
Active Pharmaceutical Ingredients (API’s) are produced and purified in a sequence of process steps, typically involving fermentation or synthesis (upstream), primary recovery/dewatering, followed by downstream purification. A filtration and a drying step are commonly used for downstream batch-processing of crystalline products or intermediates. The agitated Nutsche-type filter dryer (Figure 1) allows repeated cycles of filtration and washing, followed by drying at vacuum conditions without manipulation of the wet filter cake.
The relatively long timescale of the drying step performed in the filter dryer typically comprises a production plant bottleneck. When a bottleneck exists at the end of a production process, for example when the filter dryer is used to dry the final API or final intermediate in a production plant, unexpected events will not only affect the ongoing batch but may as well complicate the prior production steps that may simultaneously be handling another batch.
In this post, model-based scale-up is illustrated as a decision-supporting tool for the design engineers, as it allows for quantification of the process performance for an uncertain design input space to ultimately design a robust process. This is a reoccurring challenge for technology transfer projects in contract manufacturing organizations (CMO’s) as highlighted by Amgen in [1].
Physical Phenomena in Vacuum Filter Drying
The Nutsche-type filter dryer is typically a cylindrical vessel with a filter screen covering the bottom and an agitator in the centre axis. The equipment is fitted with a heat jacket on the side and the bottom (see Figure. 1).
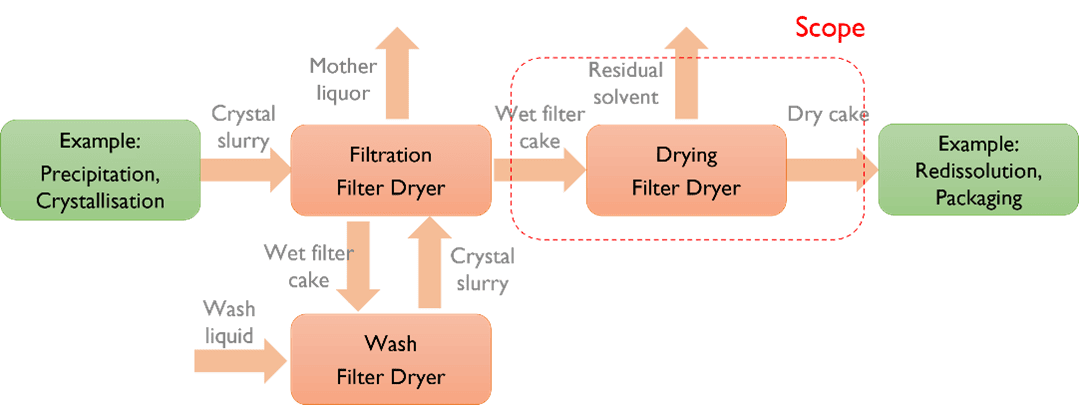
During operation, the wet filter cake is charged onto the filter screen in the filter dryer. Filtration can be carried out by establishing a pressure difference across the filter cake. The cake can be washed as a piston wash by distributing wash liquid over the surface or as a mixing wash by charging wash liquid followed by agitation. The filter cake is smoothened by agitation to ensure a homogeneous drying process (even distribution of pressure drop across filter cake). Drying is initiated by establishing a vacuum in the headspace and heating the jacket. Continuous or intermittent agitation is performed during the drying, with the latter describing frequent short-duration agitation with no agitation in-between. Figure 2 summarises the process steps.
Murru et al. [2] provide a mathematical model for the drying process in the Nutsche-type filter dryer. The model accounts for evaporation, mass flux in pores, heat conduction, and intermittent agitation. COMSOL [3] offers already the model implementation in its model library. We introduced a new case study, intermittent agitation, and uncertainty analysis.
API Quality Considerations
Critical quality attributes (CQA’s) are essential parameters in the pharmaceutical industry in communicating the link between patience safety and production process variables. Depending on the product and its use, examples of CQA’s are particle size distribution (PSD) characteristics and residual solvent concentration. In addition, these parameters may also impact the capacity of the following processing steps due to, for example, altered powder flowability.
The extent of mixing comprises a common trade-off in many processes: Process time versus product quality (see also [4] for liquid mixing processes). Process time (i.e., drying time) is shortened by agitation by effectively distributing the hotter wet filter cake near the equipment surfaces. The product quality will on some occasions be negatively affected by increasing the amount of agitation as mechanical wear on the particles tends to reduce the mean particle size, and hence PSD. The impact of PSD on the drying time may be rather complex and will not be discussed further in this post. Agitation can also promote undesired agglomeration if the solvent content is above a certain value (“sticky point”).
Although the presented mathematical model does not describe the PSD, the number of performed intermittent agitations (or estimated time) can be used as a qualitative threshold based on laboratory scale data.
Filter Drying: Numerical Example
The below example illustrates the drying of API “A” resulting from methanol crystallization and filtration. Physical parameters are taken from open-access databases and Murru et al. [2].
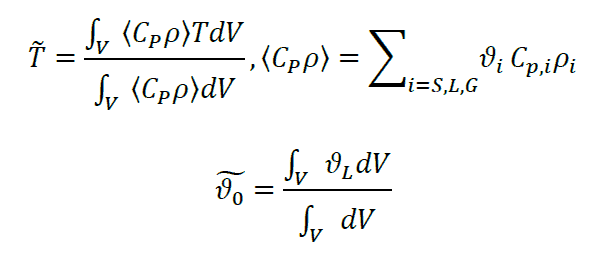
Intermittent agitation is implemented with the assumption that the filter cake becomes instantaneously homogenized using the volume-averaged states [2]. This entails that when intermittent agitation is introduced, the time-dependent solver is restarted as an initial value problem following the previous solution, but with the mean variables given below as initial values:
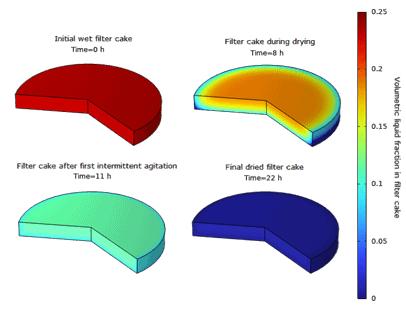
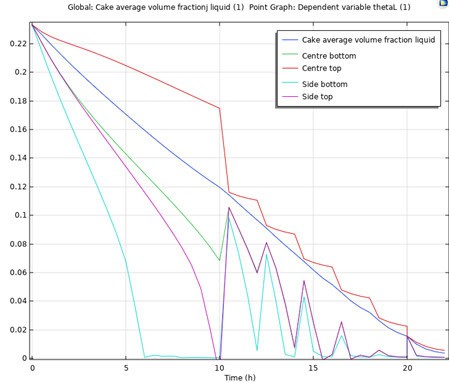
Considering a “sticking point” of 13% volume fraction liquid, we introduce intermittent agitation after 10 h drying corresponding to an average volume fraction of 10% and reintroduce intermittent agitation every 2 hours until the required residual solvent concentration (mass-based) is below the product specification, denoted by the maximum threshold value of WL,spec = 0.004.
The deterministic nominal time-dependent solution is obtained by simulation assuming that we want a 24 h cycle to account for a 2-hour change-over duration between batches or sub-batches.
The nominal time-dependent volume fraction curves are illustrated in Figure 3 and Figure 4.
The true thermal heat conductivity of dry filter cake (λdry), the initial filter cake temperature (T0), the heat transfer coefficient (hq ), and the headspace pressure (pG) are found within uniform distributions, while the true initial filter cake residual solvent concentration (wL0) and initial solid volume fraction (ϑS) found within normal distributions, all distributions are given below:
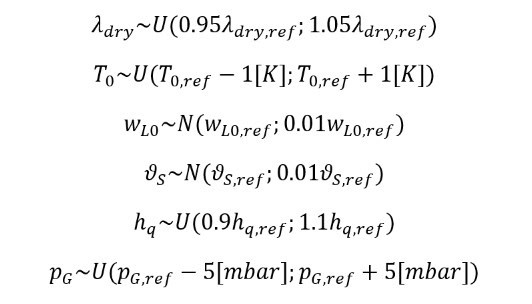
Estimates for probability distribution parameters for process parameters are established in the design phase and verified during equipment qualification and validation, while physical properties are available for laboratory data. MOAT analysis was used to reduce the uncertain parameters from six to the following four parameters: λdry, wL0, ϑS, and pG. A following global sensitivity analysis using Sobol indices revealed that the headspace pG is the most significant parameter.
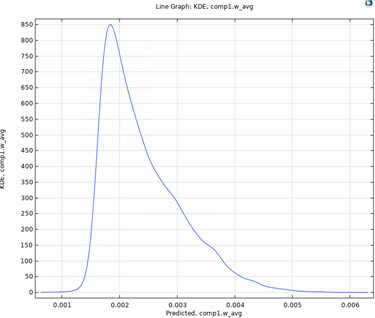
The kernel density estimation based on COMSOL’s uncertainty propagation analysis is depicted in Figure 5 based on a sample size of 10000. The figure reveals a complex uncertainty propagation pattern arising from the analytical input probability distribution functions of the uncertain parameters. The following characteristics are obtained: mean 0.0024, upper 95% confidence bound 0.040, and lower 95% confidence bound 0.0016. A design that has a 95% confidence of satisfying product specifications may be presented to management to decide on further improvements or acceptance by considering additional costs.
Conclusion
Simulation is a useful tool to analyse systems with coupled physics in complex geometries. We here illustrated a simulation of the course of the drying process in a Nutsche-type filter dryer, which is described by coupled heat and mass transfer in a 2D axisymmetric system. COMSOL enables a rapid establishment of a nominal simulation case such that more focus can be paid on value generation, including results analysis, optimizations, scenario analysis, uncertainty analysis, etc.
Simulation can be used as a decision-support tool for several reasons:
- Identification of sensitive design variables (e.g., by means of sensitivity analysis) in the early design phase, to prioritize experimental efforts and design of experiments.
This example: The filter dryer headspace pressure has been identified as the most significant contributor to the variance in the final solvent residual concentration, thereby needing additional attention during the design phase or commissioning (e.g., special attention to pressure controller design, vacuum system design, and/or warning limits). - Quantitative verification of equipment specifications against product specifications using a deterministic or probabilistic simulation model.
This example: Headspace pressure controlled at setpoint ± 5 mbar (and remaining uncertain parameters), gives a probability of 95% to satisfy the product specification ≤ 0.4% kg/kg residual solvent content. - Low-effort testing of new operational strategies or geometric designs.
This example: Evaluate the impact on drying time or design robustness for vendor equipment options, e.g., heating in agitator blades in filter dryer.
Note that additional optimization studies further allow for improving the intermittent agitation scheme.
How can resolvent aid in the pharmaceutical industry?
In resolvent, we combine our extensive experience with modelling and simulation tools with the clients’ expert knowledge to generate a platform for virtual experiments. Some examples of its uses are the following:
(1) a tool for building general process knowledge,
(2) a decision-making tool in design phases, for example (i) assisting in identifying critical operating ranges, functions, and phenomena relevant to requirement specifications for equipment, (ii) quantification and impact assessment in process risk management, or (iii) by benchmarking of new technologies against known technologies.
(3) a digital representation of a physical process (“digital shadows”,) that may aid in rapid problem analysis or impact assessment in production to eliminate/reduce additional testing.
We always emphasize close collaboration with our customers, as it is our experience that this is crucial to a successful project outcome.
See also a post regarding the analysis of mixing in vessels [4,5] that is relevant to various types of equipment in both upstream and downstream processes.
Sources:
[1]. COMSOL News 2018, page 9, https://cdn.comsol.com/resources/pdf-offers/comsol_news_2018.pdf
[2]. Murru, M., Giorgio, G., Montomoli, S., Ricard, F., Stepanek, F. “Model-based scale-up of vacuum contact drying of pharmaceutical compounds”. Chemical Engineering Science 66 (2011) 5045–5054. doi:10.1016/j.ces.2011.06.059
[3]. COMSOL Application ID: 42561, https://www.comsol.com/model/vacuum-drying-42561
[4]. Mixing Optimization in Pharma Industries through CFD simulation (resolvent.com)
[5]. Mixing and simulation in Pharmaceutical and Chemical Industries (resolvent.com)